
Calumet Deep Dive
Calumet ($CLMT): The SAF Bottleneck Priced as a Refining Stub

Introduction

Every gallon of gasoline pumped at a US station and every gallon of diesel burned by a US trucker carries an invisible passenger: a federal mandate that says some of that fuel must come from a renewable source. The mandate is the Renewable Fuel Standard, passed in 2005 and expanded in 2007. The mechanism is a credit called a RIN, short for Renewable Identification Number. A biofuel producer (someone making renewable diesel from soybean oil, sustainable aviation fuel from used cooking oil, or ethanol from corn) generates one RIN for every gallon they make. A traditional refiner has to surrender enough RINs to the EPA each January to cover its share of the annual biofuel mandate. Refiners can either blend the biofuel themselves and earn the RINs, or buy RINs from biofuel producers in the open market. There is no third option, and the penalty for non-compliance exceeds the cost of a RIN at any market-clearing price.
The system is designed to put a steady financial reward on every gallon of biofuel produced. When biofuel supply is comfortable relative to the mandate, RIN prices stay low, and the program runs quietly in the background. When supply tightens, RIN prices spike, and the producers selling those credits make a lot of money. The single most important number in the entire RFS program is the size of the carryover bank: the pile of unused RINs sitting in the system from prior years. The bank is the shock absorber. It has never been negative.
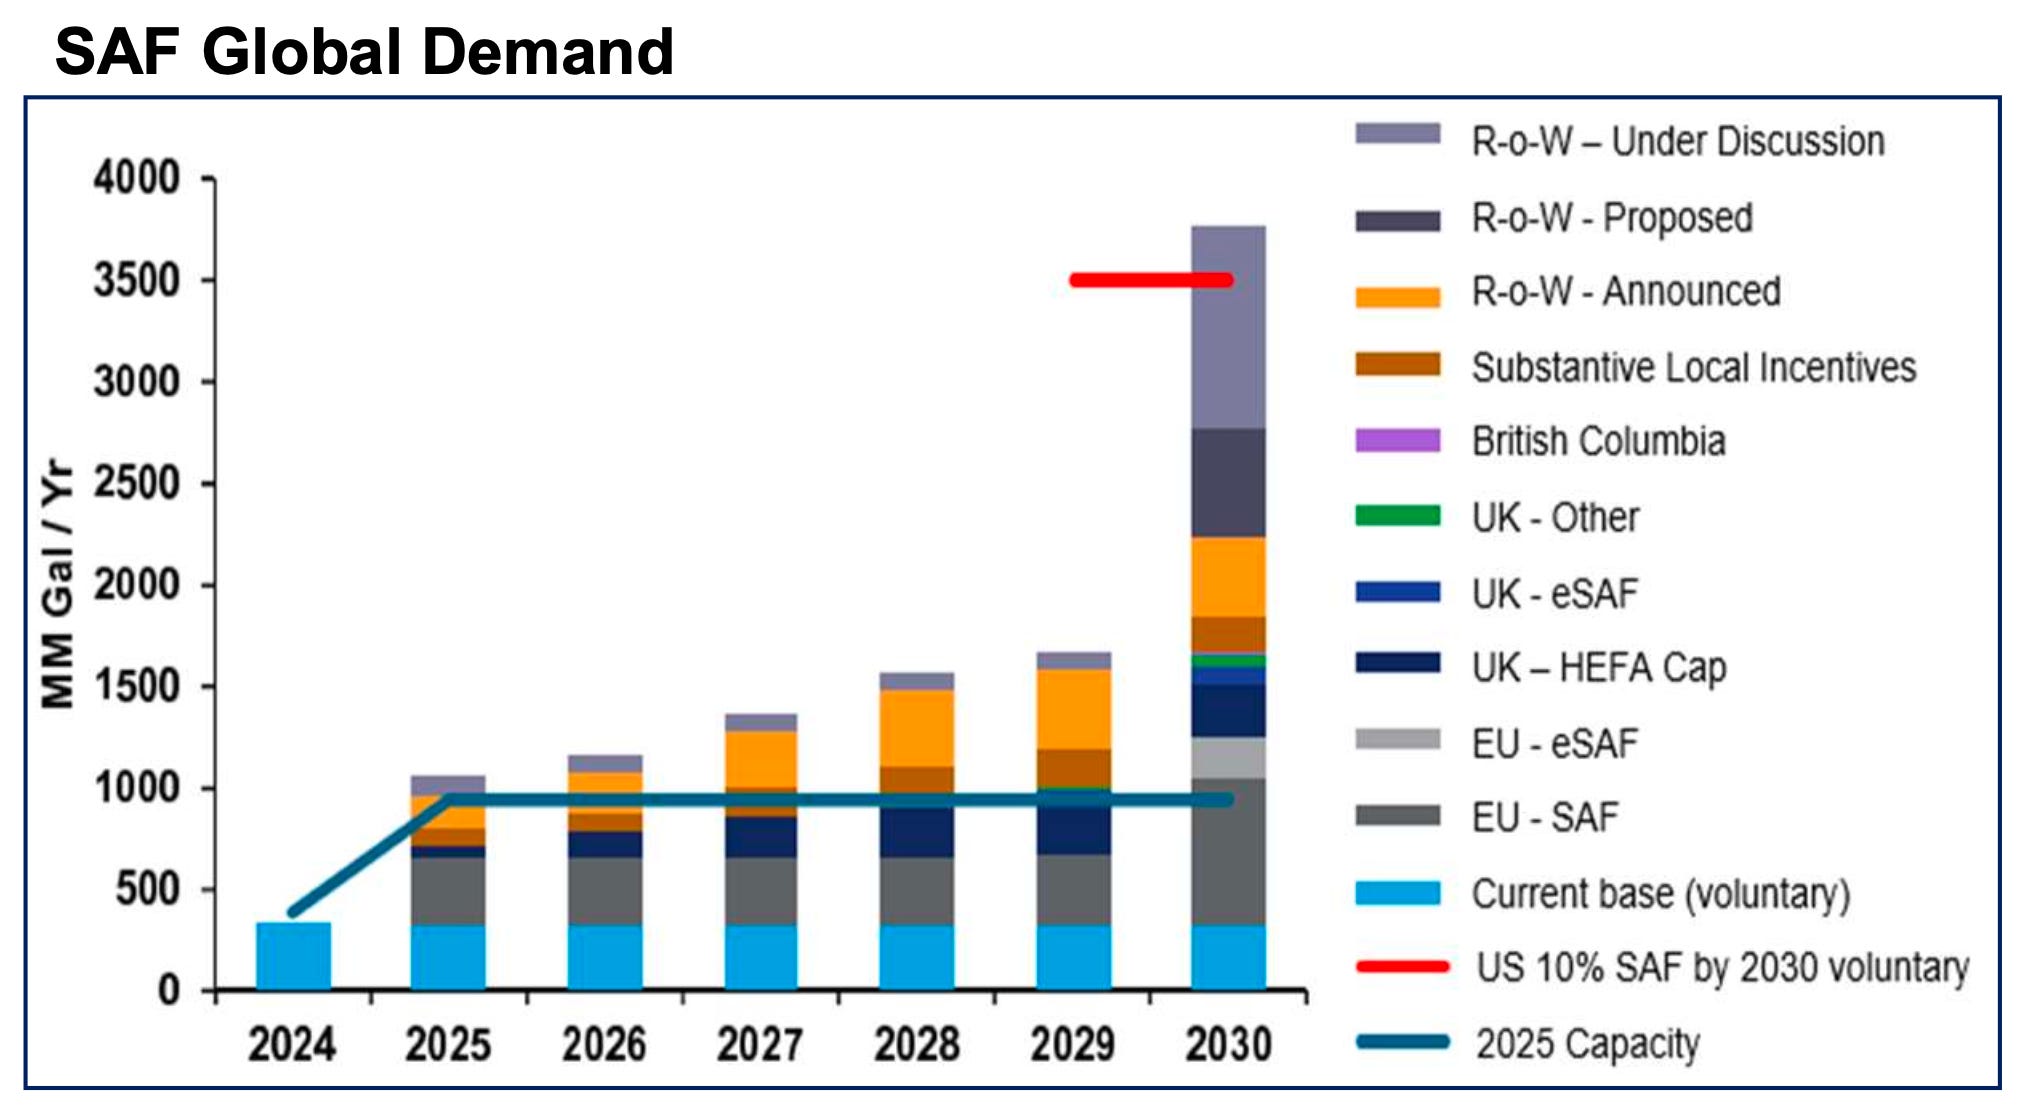
Heading into early 2025, the bank held about 3.6 billion RINs. Comfortable. Refiners cleared their compliance with carryover credits, panic was nowhere on the radar, and the equity market priced renewable diesel and sustainable aviation fuel producers as cyclical refiners overproducing into a glut. D4 RINs (the credit category specific to biomass-based diesel and SAF) traded at a spot price of $0.41 in February 2025. Biofuel producers were losing money. Several plants idled. The category looked broken.
On March 27, 2026, the EPA signed the final rule for Set 2, the renewable volume obligations for 2026 and 2027. The numbers were the highest in the program’s twenty-year history. Biomass-based diesel obligations of 8.86 billion D4 RINs for 2026 and 8.95 billion for 2027. On top of that, EPA reallocated 70 percent of the small-refinery exemptions granted from 2023 to 2025, layering hundreds of millions of additional RIN obligations onto the explicit volume requirement. And the regulation reset the renewable diesel “equivalence value” from 1.7 RINs per gallon down to 1.5 (most producers can petition for and receive 1.6), meaning that for the same compliance obligation, refiners suddenly need to source materially more physical gallons of renewable diesel.
When you do the math, the bank goes from a 3.6 billion RIN surplus at year-end 2024 to roughly a 930 million RIN deficit by year-end 2027. Two analysts running independent models (Sabrina Gutierrez at Bloomberg and Scott Irwin at the University of Illinois) arrive at substantively the same trajectory. A negative RIN bank has never happened in the twenty-year history of the RFS. When the bank goes negative, refiners are legally obligated to retire credits that physically do not exist. There is no historical price ceiling to reference, because the regime under which the bank goes negative has never existed. D4 RINs hit $1.90 per RIN in 2021-2022, when the bank was merely tight. The forwards have not yet repriced for the deficit; the December 2026 ICE D4 contract trades at $1.00 to $1.25 as of late April 2026. The bank arithmetic implies the curve has to clear meaningfully higher to balance the system. That gap between current forwards and the structural math IS the trade.
Now the second piece. While EPA was finalizing Set 2, a parallel regulatory shift was happening on tax policy. The Inflation Reduction Act of 2022 created a federal tax credit, §45Z (the Clean Fuel Production Credit), that pays biofuel producers up to $1.00 per gallon based on the fuel’s cleanness. In July 2025, the One Big Beautiful Bill Act (OBBBA) extended the credit through 2029 and added a critical condition: starting in 2026, biofuels made from foreign feedstocks no longer qualify. Used cooking oil from Asia, palm derivatives from Indonesia, and Brazilian sugarcane all become ineligible for the federal credit. Half of the global sustainable aviation fuel supply chain was made non-compliant overnight. Domestic feedstocks (US tallow, US-grown camelina, US-rendered yellow grease) became the only path to the credit.
Now the third piece. International aviation has its own clean-fuel mandate, called CORSIA, run by ICAO (the UN agency that regulates international aviation). Starting January 2027, every international airline must offset a portion of its carbon emissions, either by buying carbon credits or by buying CORSIA-certified sustainable aviation fuel. This applies to 193 countries. With global SAF supply currently at roughly 0.6 to 0.8 percent of jet fuel consumption, the scarcity of supply puts an enormous premium on producers certified to participate.
Stack it together. EPA tightened domestic compliance to a level never seen in 20 years. Treasury made foreign feedstocks ineligible for the federal tax credit. ICAO made international SAF compliance mandatory in twenty months. Three regulators in three different jurisdictions simultaneously decided that domestic, low-carbon biofuel producers should make significantly more money in 2026 and 2027 than they did in 2025.
There is one publicly listed US biofuel producer at scale heading into the squeeze with a federally-anointed brownfield expansion online in Q2 2026, roughly 100 million gallons of capacity already pre-sold under multi-year take-or-pay contracts at $1 to $2 per gallon premium pricing, the lowest carbon-intensity score in the certified CARB pathway database, US-grown camelina and tallow as feedstocks, a $1.44 billion Department of Energy loan funded at 4.884 percent fixed, and a contractual sponsor-driven exit clock activating in sixteen months.
That company is Calumet Inc., listed on NASDAQ under the symbol CLMT. The company is primarily a Louisiana-based specialty refiner that converts crude oil into specialty chemicals (high-grade lubricants, base oils, waxes, solvents, and naphthenic oils) sold under brand names such as Royal Purple, Bel-Ray, and TruFuel. The specialty business has been around for decades and generates stable cash flow. In 2022, Calumet did something the market did not initially understand. They took a 1950s asphalt refinery in Great Falls, Montana (a sunset asset that was supposed to spend the next twenty years cooking heavy Canadian crude into paving binder) and reconfigured it into a renewable fuels facility now called Montana Renewables, or MRL. MRL is technically a separate corporate entity inside Calumet, structured as an “unrestricted subsidiary,” meaning its debt is not recourse to the rest of the company. MRL is the asset that matters most.
Calumet trades at about ~$32 per share, with a market cap of ~$2.9 billion and an enterprise value of ~$5.2 billion. The company has roughly 1,200 employees. It has had two financial restatements in the last eighteen months. The stock has run from ~$7 to ~$32 over the past year, mostly on regulatory developments and competitive collapse rather than reported earnings. Sell-side targets cluster between $26 and $38 (UBS $26, TD $19, Goldman $34, Bank of America $38, Raymond James Hold), with one outlier at HC Wainwright at $60. Most analysts model the renewables segment at around $200 million of EBITDA in 2027 and stop there.
Here’s what I think the market is getting wrong.
The market sees: A leveraged Louisiana specialty refiner with an unfortunate Montana adventure that has bled cash for three years. Volatile. Unprofitable on a GAAP basis. Two restatements in eighteen months. Management substituted “Adjusted EBITDA with Tax Attributes” for headline EBITDA as soon as the underlying segment numbers turned negative. One director (Daniel Sajkowski) reduced his position by roughly half over the past year, with the bulk of those sales executed at $10 to $15 during the run-up. Hard to model. Easy to dismiss.
The reality: The only US-domiciled SAF producer at scale heading into a compliance market the EPA has legally locked short through 2027. A $1.44 billion DOE Title 17 loan funded at 4.884 percent fixed (Treasury + 37.5 basis points), non-recourse to the rest of the capital structure. ~100 million gallons of SAF pre-sold under multi-year take-or-pay contracts at $1 to $2 per gallon premium. Top-four globally on the IATA/RSB SAFc retirement registry by certificate volume. The Department of Energy’s Loan Programs Office, rebranded under the Trump administration as the Office of Energy Dominance Financing, names MRL on its public website as expected to produce “about half of all North American SAF and about 12% of all global SAF through 2030.” Contractually obligated to monetize by August 2027 under Warburg Pincus’s preferred-equity force-monetization right.
What’s going right: The MaxSAF 150 expansion (which lifts SAF output from 30 million gallons annually to 120 to 150 million) was over 70 percent complete and on schedule per the April 2, 2026, operational update, with Q2 2026 commissioning targeted. Roughly $93.5 million of §45Z transferable production credits were sold under IRC Section 6418 in 2025, and the auditor reversed a deferred-tax-asset valuation allowance, citing “sufficient positive evidence to support the realization” of the credits. Q4 2025 MRL operating costs printed $0.42 per gallon, down from $0.70 a year prior. The Specialty Products & Solutions segment annualized at roughly $369 million of Adjusted EBITDA in the second half of 2025, well above the $300 million mid-cycle that bear cases continue to use. The Royal Purple Industrial divestiture closed in March 2025 for roughly $110 million, resulting in a $55.8 million gain. The Trump-era DOE released the first $782 million tranche of the federal loan on schedule in February 2025. World Energy, the company that pioneered commercial SAF in 2016, signed a 70 million-gallon three-year supply agreement with MRL on February 19, 2026, becoming MRL’s customer rather than its competitor. Two Seas Capital LP tripled its position over the past year (roughly 6.98 million shares plus 1.12 million call options, about 8 percent ownership, the largest institutional holder). The execution signals over the last twelve months are materially stronger than at any prior point in MRL’s history.
Most investors and most refining analysts evaluate renewable fuel producers on RD margin, feedstock spreads, and operating leverage. They’re asking the wrong question. The most important variable in this market is regulatory eligibility for the federal credit stack. A 13,000-bpd biofuel producer that ranks in the top four on the global SAFc retirement registry, builds on US-grown camelina and tallow, scores 26.23 grams of CO2 per megajoule on the certified CARB pathway, and qualifies for full §45Z value post-OBBBA isn’t an incremental improvement over previous-generation renewable diesel chemistry. It falls into a regulatory category of 1.
The OBBBA doesn’t tax foreign feedstocks. It vetoes them. Every gallon of SAF or renewable diesel made from Asian used cooking oil, Indonesian palm derivatives, or Brazilian sugarcane carries an invisible stamp that reads “ineligible for federal credits.” Phillips 66 Rodeo, the largest registry-share SAF producer in the world, sources heavily from Malaysia and Indonesia. MRL’s gallons do not carry such a stamp.
The closest historical analog to what is happening with CLMT is Cheniere Energy in 2017. Cheniere was the first US company to ship liquefied natural gas internationally, but for years the public market priced it like a utility, capping its multiple at levels for refining and energy infrastructure because the analytical category was wrong. The private market eventually cleared at infrastructure multiples once the take-or-pay contracts started flowing through earnings. Cheniere went from approximately $50 in 2017 to over $150 by 2022, peaking near $200 in 2023, roughly 4x in five years. The structural setup was identical to what CLMT has today: regulator-driven demand inflection, capacity-constrained physical supply, non-recourse project financing on the asset itself, take-or-pay contracts validating offtake, and a sponsor-structured monetization clock. The renewable diesel and SAF version of that mispricing is unfolding now, and Calumet is the analog the market has not yet identified.
Big shout-out to @Zerosumgame33, @GavMcCracken, and @toiletkingcap on X for the original introduction to CLMT and the continuous high-quality posts that anchored this work.
The Physics of a Negative RIN Bank
The EPA wrote a regulation. Treasury wrote a tax credit. ICAO wrote a chain-of-custody standard. None of these are forecasts. They are rules. The math that follows has nothing to do with narrative; it is what happens when obligated parties are legally required to retire instruments that physically do not exist in sufficient quantity.
Plain English
Think of a RIN as a “compliance ticket.” Every gallon of biofuel produced under an EPA-approved pathway generates one. Every refiner that puts gasoline or diesel into the US market is legally required to retire a certain number of these tickets each year, like turning in tax forms. They can either generate the tickets themselves by blending biofuel into their fuel pool or buy them from someone who has already generated them. Either way, the obligation gets paid.
Refiners and fuel importers have to “retire” a certain number of tickets each year to satisfy their obligations under the Renewable Fuel Standard. EPA just set the 2026 and 2027 obligations at the highest levels in the program’s twenty-year history, and added a separate pile of tickets to make up for past exemptions handed to small refiners. The pile of unused tickets in the system (the “bank”) goes from 3.6 billion at year-end 2024 to roughly negative 930 million at year-end 2027. There is no historical playbook for what happens when the bank goes negative, because it has never happened. When the bank goes negative, refiners are legally required to retire tickets that physically do not exist. Prices that clear at whatever level either incentivize massive new biofuel production (which takes years to build) or destroy demand. That price spike, captured by every gallon of biofuel MRL produces, is the trade.
The RVO mechanics
Set 2 sets the biomass-based diesel volume requirement at 8.86 billion D4 RINs for 2026 and 8.95 billion for 2027. EPA reallocates 70 percent of the 2023 to 2025 small-refinery-exempted volumes to 2026 and 2027, layering an additional 210 million RINs into 2026 and 250 million into 2027 onto the explicit BBD line. EPA also embedded a forward-looking SRE pool that assumes 2022 to 2024 average exempted volumes will recur in 2026 and 2027. After reallocation, BBD applicable volumes are 9.07 billion RINs for 2026 and 9.20 billion for 2027.
The D6 to D4 nesting math
A second piece of the bank trajectory that consensus models miss. The Renewable Fuel Standard divides biofuels into four tiers (D-codes), graded by how clean they are: D3 (cellulosic), D4 (biomass-based diesel, as MRL produces), D5 (advanced), D6 (conventional ethanol). Higher tiers can be used to satisfy lower-tier obligations, but not vice versa. Think of it like college credits: a graduate-level course satisfies an undergraduate requirement, but an undergraduate course does not satisfy a graduate one.
Conventional ethanol RIN obligations under the 15 billion gallon implied conventional volume cannot be satisfied at scale because gasoline demand is flat to declining, and ethanol cannot grow into a shrinking gasoline pool (the “E10 blend wall,” the practical ceiling above which ethanol cannot be blended into gasoline without engine damage). When the conventional ethanol obligation cannot be physically met, every shortfall must be backfilled with D4 RINs because nesting works in only one direction. The 70 percent SRE reallocation reduces conventional volumes in 2026 and 2027 that cannot be met with corn ethanol due to the blend wall. Add roughly 700 million of stealth D4 demand on top of the explicit BBD RVO. This is the part the bank model captures correctly, and consensus EPS models routinely miss.
The bank trajectory
Sabrina Gutierrez of Bloomberg and Scott Irwin at the University of Illinois run independent compliance models. Gutierrez published her post-Set 2 update on April 2, 2026: 2024 non-cellulosic net RIN bank closed at 3.58 billion, 2026 carryover ~540 million, 2027 ends at a ~930 million deficit. Irwin’s farmdoc analysis runs the same calculation from a different direction and lands on the same shape. Two analysts running independent models and arriving at substantively the same trajectory is the methodological tell. This is not a narrative. It is forced by Set 2, the reallocation arithmetic, and the equivalence-value reset.
Connecting the bank to D4 RIN pricing
D4 RINs hit $1.90 in 2021 to 2022 when the bank was merely tight, never negative. There is no historical price ceiling to reference because the regime under which the bank goes negative has never existed. ICE Dec 2026 D4 RIN futures are trading in the $1.00 to $1.25 range as of late April 2026, recovered from the February 2025 trough of $0.41 but well below the levels implied by the Bloomberg/Irwin negative-bank trajectory. The forward curve has moved off pre-Set 2 lows (December 2025 OPIS D4 printed $1.1125; the 2026 vintage trades at roughly a 5-cent premium to D6) but has not yet incorporated a sustained negative-bank regime.
The equivalence-value reset
Here is the part most find confusing. RINs are measured in “ethanol equivalent gallons,” not physical gallons. Because renewable diesel has more energy per gallon than ethanol, each physical gallon of renewable diesel currently generates 1.7 RINs. Effective January 1, 2027, EPA cuts that ratio to 1.5 by default. Most producers, including MRL, can petition for and receive 1.6.
Why does this matter? Same RIN obligation, same regulatory volume target, fewer RINs per physical gallon means refiners need to source MORE physical gallons of renewable diesel to meet the same compliance number. At 1.6, the same 8.95 billion RIN obligation requires 5.59 billion physical gallons (vs 5.26 billion at 1.7), a ~6 percent increase in demand on top of the bank deficit. At the default 1.5, it is 5.97 billion gallons, a 13 percent increase. Higher physical-gallon demand on a shrinking RIN bank is the closing argument. Pricing has nowhere to go but up until either supply ramps or the obligation is waived.
The §211(o)(7) waiver case
The general waiver under the Clean Air Act has never been triggered in the 20 years since it was enacted. The path of least resistance for a Trump White House if D4 prints $2.50+ and gasoline rolls 30 to 50 cents per gallon at the pump heading into the November 2026 midterms is more SRE relief, possibly partial, before the general waiver. SRE grants flow back as RVO reallocations on the next compliance cycle, so structural pressure does not disappear; it is deferred. Waiver tail risk is real but low, perhaps 10-15% probability.
The implication for MRL
MRL is contracted to produce ~180 to 200 million gallons of biofuel post-MaxSAF 150 commissioning (~13,000 bpd, of which 120 to 150 mgy is SAF and 30 to 50 mgy is RD), scaling toward ~330 mgy if Phase 2 is funded. Every gallon generates RINs that legally must be purchased by an obligated party. At current ~$1.20 D4 forwards (compared to the 2025 average of ~$0.77 D4), MRL captures roughly $0.40 to $0.60 per gallon of incremental margin over 2025 levels purely from RIN economics. At the $2.00+ D4 prices implied by the bank arithmetic clearing in H2 2027, incremental margin scales to $1.50/gal and beyond. Separate from SAF premium. Separate from §45Z. On 200 million gallons, that is $80 to $120 million of incremental EBITDA at current forwards, scaling to $300M+ if D4 clears toward the bank-implied path. Goldman’s $200 million 2027 segment EBITDA estimate is approximately what the current forward curve implies for incremental RIN math, leaving zero credit for SAF premium, zero credit for §45Z generation, zero credit for LCFS, and zero credit for the macro environment. The model is anchored on what the curve currently shows; the structural arithmetic forces the curve to move.
A second self-funding feature is buried in the 10-K. MRL’s restricted-group sister facilities (Shreveport refining and the Great Falls, Montana, asphalt plant) carry a ~65 million annual RIN obligation as obligated parties under the RFS. MRL’s post-MaxSAF production generates ~320 million RINs/year (~200 mgy × 1.6 EV), of which ~255 million are surplus to internal compliance needs. At current $1.20 D4 forwards, that is ~$305 million of surplus RIN value generated annually inside the corporate family, scaling to ~$510 million at the $2.00 D4 price the bank arithmetic implies through 2027, of which a portion is sold externally and a portion offsets restricted-group compliance costs.
The trade lives in this arithmetic. Everything else is corroboration.
The Pretreatment Moat
“MRL makes renewable diesel and SAF from waste oils.” That is the standard sell-side line, repeated verbatim across coverage. It is a description, not a moat. The moat lives one layer down, in the chemistry, the catalyst stack, the hydrogen integration, and the grid configuration. Each has a specific number. Each compound.
What MRL physically does
The chemistry of turning vegetable oil into diesel is conceptually simpler than it sounds. Vegetable oils, animal fats, and used cooking oil are all built the same way: a small molecule called glycerol with three long carbon chains hanging off it, like a tree with three branches. Diesel is just made of long carbon chains (typically 16 to 18 carbons long). Jet fuel has shorter chains (8 to 15 carbons). So the raw material is already in approximately the right shape. The job is to chop off the glycerol backbone, clean up the chains, and adjust their length to whatever fuel you want. That is what HEFA, the Hydroprocessed Esters and Fatty Acids process, actually does.
MRL runs HEFA, the same general pathway used by Neste, Diamond Green Diesel, and the Phillips 66 Rodeo conversion. The feedstock is triglyceride material: vegetable oils (canola, camelina, soybean), tallow, used cooking oil, distillers’ corn oil, and brown grease. The conversion runs in four reactor steps:
Hydrodeoxygenation (HDO): hydrogen reacts with the oxygen atoms in the triglyceride, removing them as water. The “deoxygenation” step. Catalysts are sulfided NiMo or CoMo on a γ-Al2O3 support, ~300 to 400 °C, ~20 to 100 bar H2.
Decarboxylation/decarbonylation (DCX/DCN): a parallel pathway that strips carbon-bound oxygen as CO2 or CO. Same catalyst stack.
Hydroisomerization (HDI/HDW): the resulting straight-chain paraffins are folded into branched iso-paraffins. This step controls cold-flow properties. Jet fuel must remain liquid at -40 °C or lower (it gets cold at altitude), and only iso-paraffin-rich blends meet that spec. Catalysts: Pt or Pd on SAPO-11 or ZSM-22.
Hydrocracking (HDC): longer chains are fragmented into shorter ones, shifting the product mix from the diesel cut (C16 to C18) to the jet cut (C8 to C15).
Hydrogen consumption is ~2.5 to 3.8 percent of feedstock weight for renewable diesel and 4 to 5 percent for SAF (jet fuel requires more chain-cutting and chain-folding to hit specs). Byproducts are water, light hydrocarbons (renewable propane and renewable fuel gas, both fed back into the hydrogen plant), naphtha, and CO/CO2.
The pretreatment moat
The HEFA process has one critical vulnerability: the precious-metal catalysts that drive the chemistry are extremely sensitive. Trace amounts of phosphorus, sodium, calcium, iron, sulfur, nitrogen, or chloride in the feedstock will kill them in hours. Imagine a high-end espresso machine. Run filtered water through it, and it lasts a decade. Run hard water through it, and the boiler scales up in months. The catalyst stack is the espresso machine. Dirty feedstock is hard water.
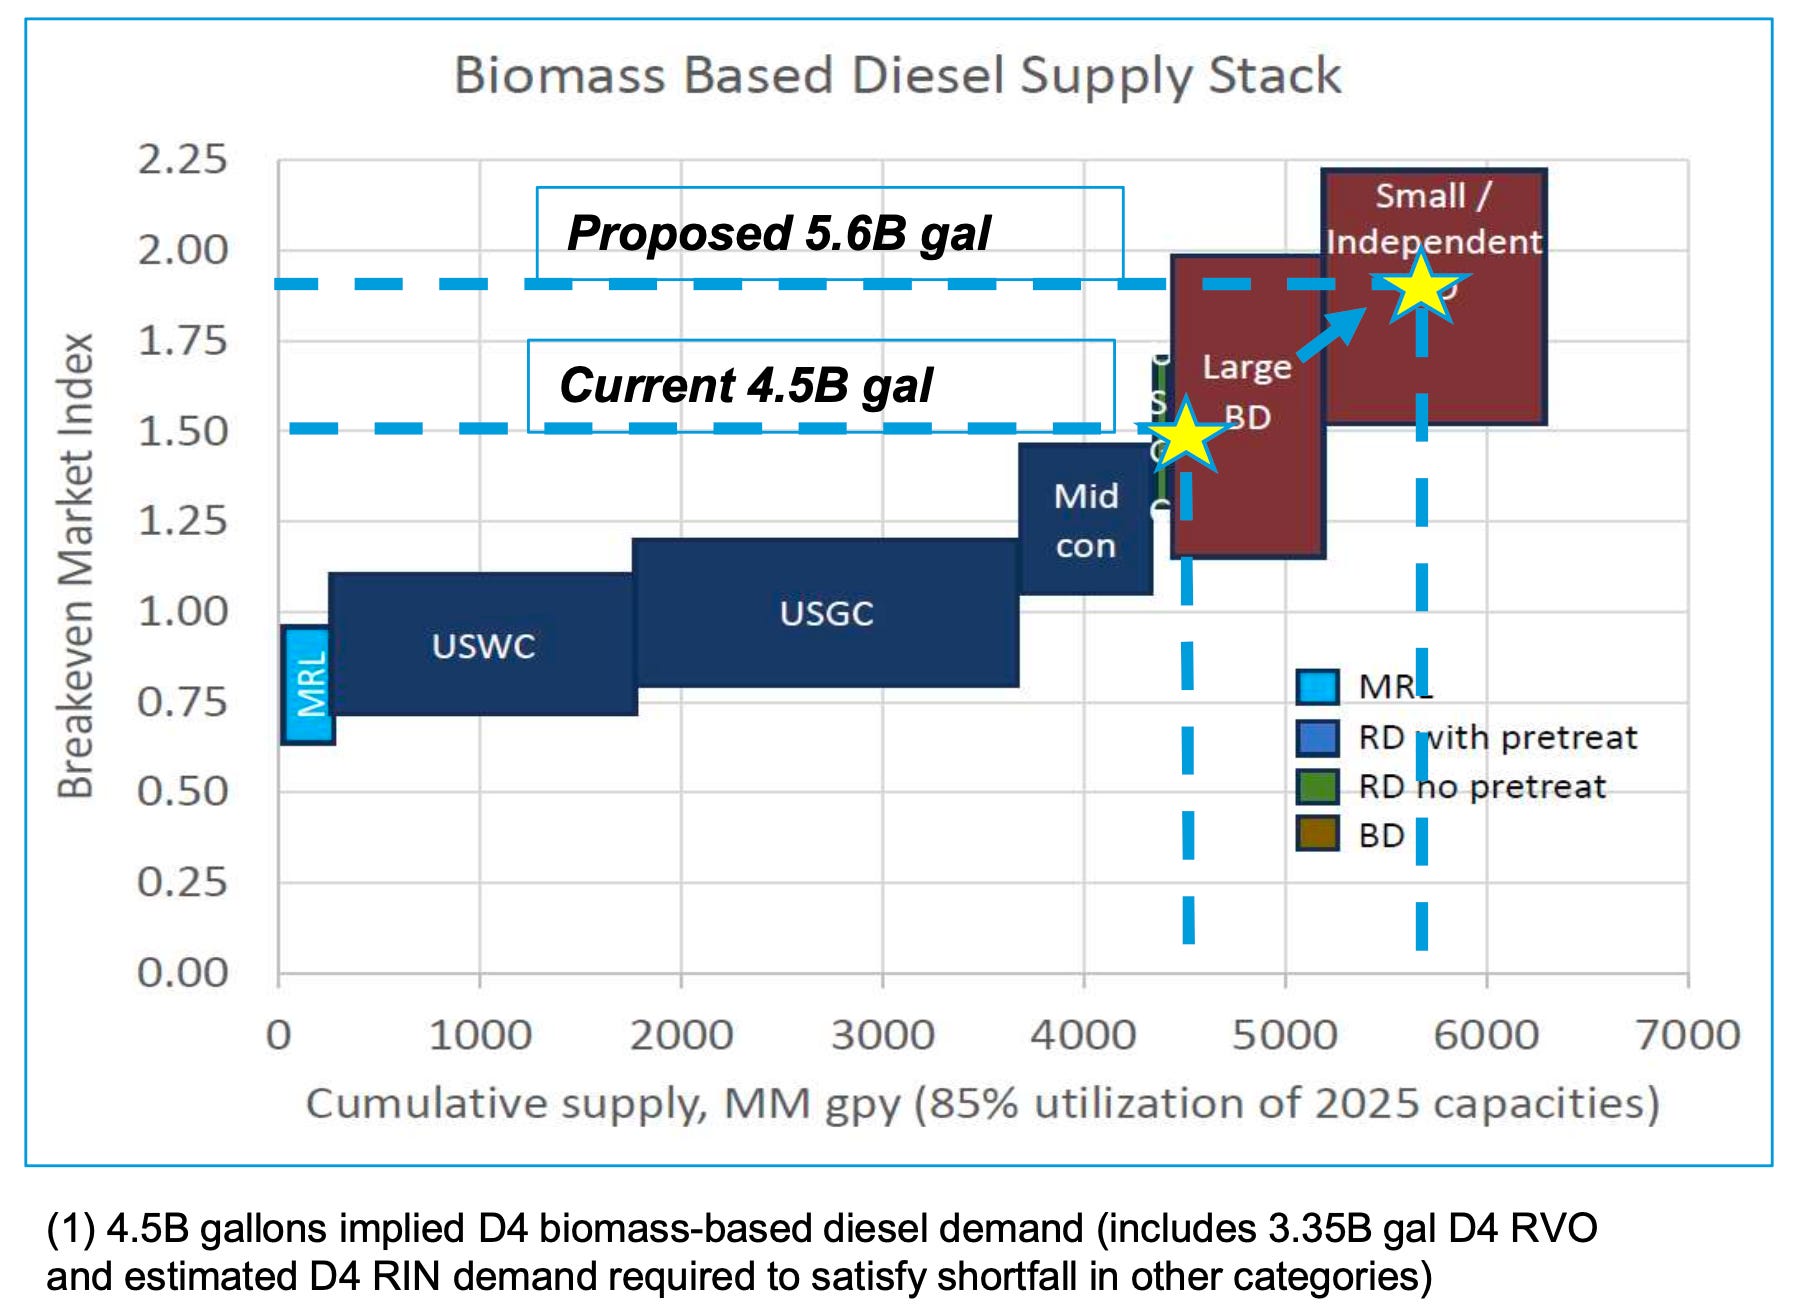
This is the problem that undermines HEFA economics with cheap, dirty feedstocks like brown grease, animal tallow, and ungummed used cooking oil. Most renewable diesel producers solve it by using clean (and expensive) refined feedstocks like soybean oil or canola, which have already been processed elsewhere. MRL solves it differently.
MRL’s pretreatment unit (PTU), licensed from Applied Research Associates, is described in MRL’s own materials as a “first-of-its-kind continuous process” engineered for high-impurity feeds at “near 100 percent yield of clean organic product.” Instead of buying expensive, clean feedstock, MRL takes dirty, cheap feedstock and cleans it on-site before it ever reaches the catalyst stack. RBD soybean oil clears $1,100 to $1,400 per metric ton. Tallow and UCO are trading at $700 to $1,000 per metric ton. The PTU lets MRL run the cheap basket at full conversion yield. Every $200 to $500 per ton of feedstock spread, captured at scale, is the structural cost advantage that the bear case cannot eliminate without rebuilding the PTU on a competitor site.
This is also why MRL captured “more than 100 percent of the renewable diesel index margin” in Q4 2025, per Bruce Fleming on the Q4 call. The published RD index is calibrated to soybean oil. MRL’s basket runs cheaper than the index baseline; that delta IS the excess capture. The honest caveat: capture is path-dependent. Q4 2025 was the lowest RD index environment ever recorded, when feedstock-spread advantages were most evident. In high-margin spot environments where every producer scrambles for the same feedstock pool, basis spreads compress and capture normalizes toward the index. Persistent excess capture, variable magnitude.
CEO Todd Borgmann has been explicit on what a normalized RD margin environment looks like, on the Q4 2025 call: “Remember that these margins were $2 to $3 a gallon on an index basis as recently as 3 years ago. So we just need to resume that kind of an environment, and we’re going to have an entirely different view of our success here.” On 200 million gallons of post-MaxSAF biofuel output, the difference between the FY2025 average RD index (~$0.77 per gallon) and the $2 to $3 per gallon Borgmann references is $245 to $445 million of incremental EBITDA at the same volume, before any SAF premium expansion, before §45Z monetization, and before any Iran-related macro overlay. Management is on tape stating the historical RD margin baseline is roughly 3x to 4x current levels. The Set 2 RVO figures and the bank trajectory in The Physics of a Negative RIN Bank are precisely the mechanism that resumes that environment.
The hydrogen and grid stack
Why MRL’s flowsheet matters and Gulf Coast competitor flowsheets do not. Carbon intensity, or “CI,” is just the carbon footprint of producing one gallon of fuel, measured in grams of CO2 per megajoule of energy. A lower number means cleaner fuel. Federal and state regulators pay producers based on how low the score is. So every advantage in the production process flows through to the credit math, dollar-for-dollar. MRL has three structural sources of CI advantage that compound:
Renewable hydrogen. Hydrogen is the molecule that drives most of the chemistry in HEFA reactors. Most renewable diesel plants buy hydrogen from industrial gas companies (Air Products, Linde, Praxair), which produce it from natural gas, a fossil fuel. MRL produces hydrogen on-site from leftover renewable propane and gas generated by the HEFA process, plus renewable natural gas. Same chemistry, much lower carbon footprint. Conventional fossil-fed steam methane reforming emits ~9 to 10 kg CO2 per kg H2; biogenic-fed reforming drops to 1 to 3 kg CO2 per kg H2. Hydrogen is the largest variable input cost in HEFA operations. When natural gas spikes, competitor opex spikes. MRL’s does not. Translated into finished-fuel CI: ~5 to 10 g CO2e/MJ avoided.
Grid carbon intensity. Where you plug in matters. Montana’s electricity comes mostly from hydroelectric dams (water through turbines, essentially zero carbon). Louisiana and Texas competitor sites are powered mostly by natural gas. Even the same chemistry, run on dirtier grid electricity, produces a higher-CI gallon. WECC-Northwest grid (~150 to 300 g CO2/kWh, hydro-dominated, drawing from five dams downstream on the upper Missouri) vs the MISO-Gulf grid that powers competitor sites (~400 to 500 g CO2/kWh). Translated into finished-fuel CI: ~2 to 4 g CO2e/MJ avoided.
Feedstock CI. Different oilseeds have different carbon footprints once you account for fertilizer, tilling, irrigation, and (most importantly) whether they displace food crops. Camelina, the cover-crop feedstock MRL, has been building through Sustainable Oils, scoring at 7.58 g CO2e/MJ on CARB’s feedstock-only basis vs. ~54 for soybean oil and ~25 to 35 for canola. Camelina also receives a zero ILUC penalty (Indirect Land Use Change, the carbon math that punishes feedstocks that displace food crops) because it grows on fallow/idle land without displacing food crops.
MRL’s CARB-certified UCO renewable diesel pathway carries a finished CI of 26.23 g CO2e/MJ under Tier 2 Application B0787 (submitted December 2024). Stack the renewable-hydrogen advantage, the WECC-NW grid, and a PTU-enabled cheap-feedstock basket and MRL’s structural CI advantage versus a Gulf Coast peer running soybean/UCO blend on a fossil-SMR/MISO-grid configuration is roughly 10 g CO2e/MJ. Each 1 g CO2e/MJ of CI advantage is worth $0.025 to $0.04 per gallon across the stacked credit regimes (LCFS, §45Z, CORSIA, RIN). At 10 g, MRL captures $0.25 to $0.40 per gallon of structural credit-stack premium that competitors physically cannot replicate without relocating the asset.
The MaxSAF reconfiguration
What physically changes when MaxSAF 150 commissions?
The reconfiguration pushes isomerization-and-cracking severity harder, fragmenting longer chains and shifting the boiling curve from the diesel cut (C16 to C18) into the jet cut (C8 to C15). SAF needs a higher iso-paraffin content than diesel to suppress crystallization at cold-soak temperatures of -40 to -47 °C. Capacity progression: pre-MaxSAF biofuel production was ~12,000 barrels per day, with SAF capped at ~30 million gallons annually; post-MaxSAF, the unit runs ~13,000 barrels per day biofuel with SAF capacity of 120 to 150 million gallons annually. Per the April 2, 2026, operational update, the project was “more than 70 percent complete and currently on time and budget”; Q2 2026 commissioning is on schedule.
~100 million gallons of SAF were already pre-sold under multi-year take-or-pay contracts at a $1 to $2 per gallon premium to renewable diesel, before MaxSAF was even online (per the Q4 2025 deck and the HC Wainwright Renewable Fuels Day deck). Adding capacity into a tightening market with the new capacity already pre-sold at premium pricing is operationally rare. The timing is comically good.
Strategic meaning
Science is the moat. MRL’s structural CI advantage is not a single feature; it is a configuration. Camelina at 7.58 g CO2e/MJ feedstock CI, plus renewable-hydrogen SMR avoiding 5 to 10 g, plus WECC-NW grid avoiding 2 to 4 g, plus the ARA-licensed PTU running impurity-tolerant feedstock at near 100 percent yield. Each 10 g CO2e/MJ of advantage compounds across four to five regulatory regimes simultaneously, year after year, into perpetuity. That is the structural moat.
Replicating it requires Montana geography, WECC grid access, Sustainable Oils proximity for camelina, ARA licensing for the PTU, Title 17 financing for the brownfield economics, and the SAFc customer book that has already been built. Capital cannot compress that timeline to less than 4 to 5 years. The compliance squeeze peaks in 2027. Capacity that has not broken ground by mid-2026 will not relieve the squeeze, regardless of how much capital is thrown at it.
